Business Strategies & KPIs
Introduces the concepts of KPIs and appropriate metrics.
We’re a UK based digital agency specialising in Adobe Analytics, Tealium, and Google Analytics.We design, develop digital content, websites and web analytics solutions that drive business growth and customer engagement.

We stay up-to-date with the latest trends and best practices to ensure that we deliver accurate and insightful analysis.

Discover who your customers really are. We segment your audience to personalize messaging, improve retention, and drive loyalty.

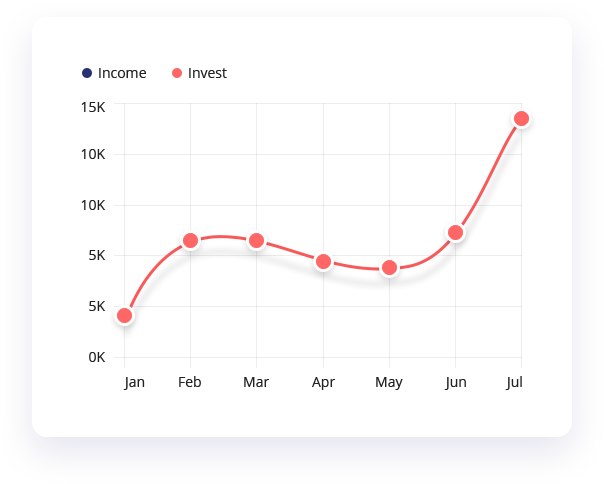
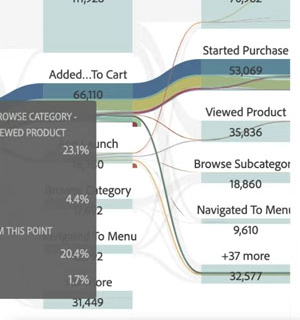
Understand how users interact with your site, uncover drop-off points, and measure campaign effectiveness with precision.

Introduces the concepts of KPIs and appropriate metrics.
Determining the total number of visits and visitors to your site
Connected to the data stored in disparate databases
Approach a problem and design the analytics solution for it.

At Pixole, every click tells a story. From the first impression to the final purchase, we help brands master their digital journey with clarity and control. Our approach is rooted in data: we design robust data pipelines, real time dashboard, and implement scalable APIs that power real-time insights. Whether it’s Adobe, Google, Tealium, Office 365, or SQL, we build integrations that work across platforms so our clients can focus on growth, not guesswork.
Our process is collaborative, transparent, and agile. We work closely with stakeholders to define objectives, map user journeys, and deliver measurable outcomes. Whether we’re refining a brand’s voice or optimizing a tagging strategy, we bring empathy, rigor, and relentless attention to detail. Our clients appreciate our ability to switch between technical depth and creative flair because in today’s digital world, both are essential.
Our mission is simple to help brands perform better, communicate smarter, and grow faster. With every project, we aim to push boundaries, challenge assumptions, and deliver work that’s both intelligent and inspiring.